
Climate change
• Average efficiency of our homes is 69.61
• £23.1m spent improving our homes
• Created £1,223,729 of social value through our energy efficiency works
We have seen a renewed emphasis from government on the importance of having warm, safe homes that are affordable to run. This has been evident in recent policy announcements in EPC measurements, a review of the 2021 Fuel Poverty Strategy and current consultations in Minimum Energy Efficiency Standards and the Decent Homes Standard. As a business we continue to assess financial viability against the cost of making our existing homes energy efficient. We also work with partners to access funding and grants to deliver programme works strategically and at scale.
The tables below show how our EPC rating for both existing and new homes have improved year on year:
| EPC rating | Percentage of homes | |||
|---|---|---|---|---|
| 2021/22 | 2022/23 | 2023/24 | 2024/25 | |
| A | 0.02% | 0.2% | 0.2% | 0.3% |
| B | 3.5% | 4.2% | 5.6% | 5.7% |
| C | 35.5% | 48.7% | 50.5% | 56.3% |
| D | 61.0% | 46.4% | 42.6% | 36.7% |
| E or less | - | - | 1.0% | 1.0% |
| No EPC | - | - | 0.01% | 0.0% |
| EPC rating | Percentage of homes | |
|---|---|---|
| 2023/24 | 2024/25 | |
| A | 15.20% | 14.4% |
| B | 81.5% | 60.4% |
| C | 3.3% | 25.2% |
| D | - | - |
| E or less | - | - |
| * The average SAP rating for our new build properties is 86.5 | ||
We have installed insulation works to 3718 homes, mostly utilising funding from the Department of Energy Security and Net Zero’s (DESNZ) Social Housing Decarbonisation Fund (SHDF) Wave 2.1 to complete works, alongside the installation of solar PV panels to over two hundred properties.
We are committed to protecting our planet, as demonstrated in our ambitious green plan and Net Zero Strategy, which commit us to a 7.5% reduction in emissions annually. We are currently working on a cost transition plan, but do not have one at present.
As part of being an ambitious business when it comes to our environmental impact, we are measuring scope 1, 2 and 3 emissions. We do not currently report on the emissions associated with our homes. Although this is a challenging metric, we feel it is the right thing to do. This metric continues to be reported as part of our corporate performance to give oversight to our Executive Management Team and our Board, all of whom are driving our environmental ambitions as a business. We have also published our emissions on our website to be transparent with our customers on how we are performing. We feel this is important and necessary as part of our role in raising awareness of the climate change agenda.
We are four years into our carbon counting and reporting and have an excellent understanding of how we are performing and what areas we need to focus on to reduce our carbon footprint. The next step in this process is to implement projects that actively reduce our carbon emissions, especially for the emissions that sit within scopes 1 and 2. We have also started to engage with our supply chain through the BE:One partnership to support them to count, report and reduce their emissions as that has a direct impact on our measurement. There is much more work to do here but early indications with the BE:One partnership have been positive in reducing our carbon footprint total.
The table below shows our carbon emissions:
| 2024/25 | |
| Scope 1: tonnes CO2 equivalent (tco2e) | 713.04 |
| Scope 2: tonnes CO2 equivalent (tco2e) | 98.06 |
| Scope 3: tonnes CO2 equivalent (tco2e) | 9,688.66 |
| Scope 1, 2 and 3: total tonnes CO2 equivalent (tco2e) | 10,499.76* |
*Change in methodology
Ecology
We have a draft biodiversity plan which is currently under review with Executive Management Team. We currently do not own any significant green space, but we feel that there is more that we could do to link our land with other natural areas.
There is also a lot we can do to improve biodiversity on the land we own and manage. This could include supporting customers to improve biodiversity in their gardens. We offer bird or bat boxes to customers whenever we need to erect scaffolding and have started to add hedgehog highways to our fencing programme. We are also working to link in with local environmental organisations to add value to the work they are doing. For example, we have supported Durham Wildlife Trust installing swift boxes across County Durham.
We have several policies that help us manage individual pollutants, such as our damp and mould policy, which we regularly review. With the introduction of Awaab’s Law in October, we continue to work to understand how we can manage the presence of possible hazards in our customers’ homes. We have also adopted approaches to service delivery that ensure our operating procedures align to our aim to reduce pollutants. An example of this is the removal of lead piping at void stage.
Building safety and quality
• 82.3% of our customers feel their home is safe (Tenant Satisfaction Measure)
• 75.6% of our customers feel their home is well-maintained (Tenant Satisfaction Measure)
• 83.7% of our homes had a decent homes survey in the last five years (Tenant Satisfaction Measure)
As a business, we continue to closely monitor our compliance metrics. This is done through our corporate scorecard, health and safety report, and regular updates from our Compliance Manager to our Board and Committees. The introduction of the consumer standards last year has given us time to reflect on how we demonstrate our compliance in a meaningful way to our tenants as well as the business and we continue to provide regular communications to ensure this message is clear to our customers.
| 2023/24 | 2024/25 | |
| % of homes with a gas appliance that have an in-date, accredited gas safety check | 99.97% | 99.98% |
| % of buildings that have an in-date and compliant fire risk assessment | 100% | 100% |
| % of homes that meet the national housing quality standard | 100% | 100% |
| % of required asbestos surveys carried out | 100% | 100% |
| % of required water safety checks carried out | 100% | 99.50% |
| % of required life safety checks carried out | 100% | 100% |
Resource management
As part of our procurement process, all contracts undergo full PESTLE (Political, Economic, Sociological, Technological, Legal and Environmental) analysis, which considers the impact on the environment in terms of sustainability, waste, recycling, disposal, carbon footprint and emission reduction.
We have a strong contract management framework, performance managing each contract and regularly assessing whether the contractor is meeting the agreed delivery against 11 different elements of the framework. This allows us to make proactive decisions on what we are delivering for our customers.
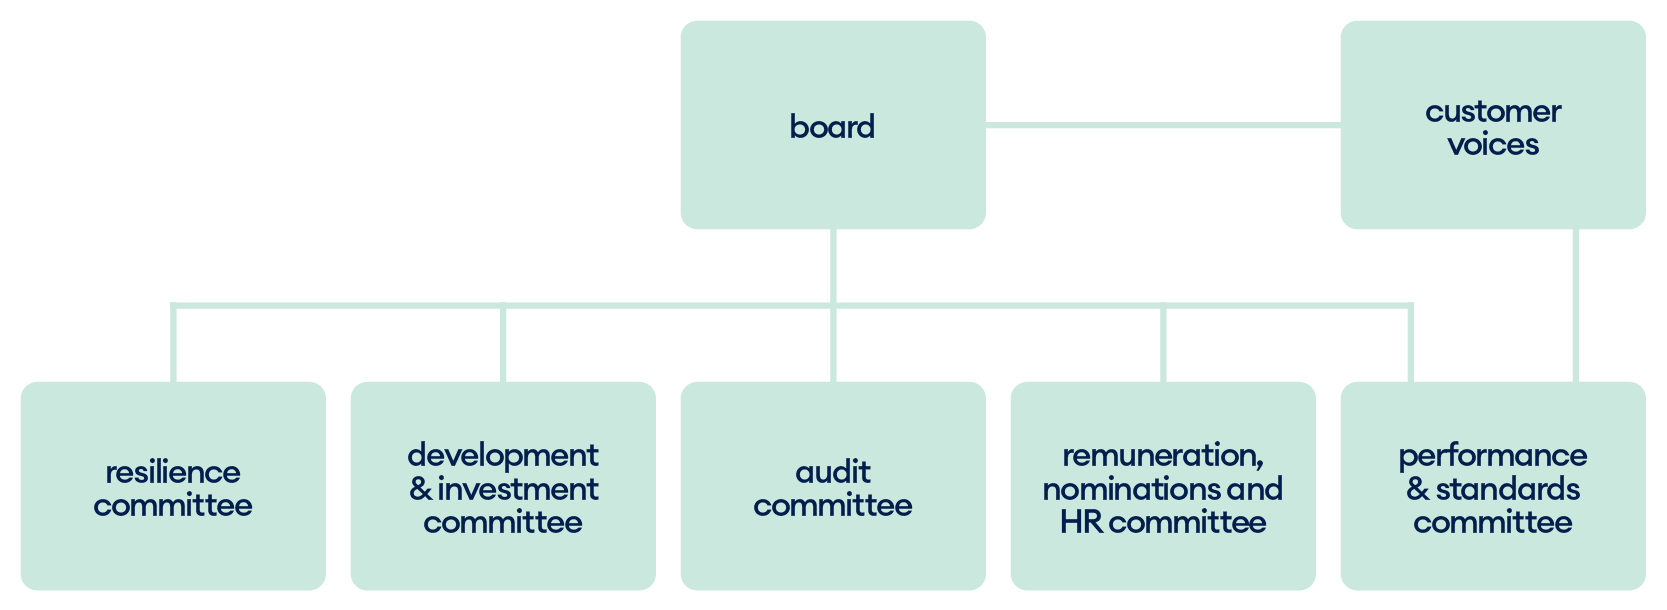
Structure and governance
We are a not-for-profit regulated provider of social housing currently rated as V2/G1 by the regulator of social housing, and we have adopted the NHF Code of Governance 2020, ensuring our governance structure remains fit for purpose. Our approach to governance is reflected in our values of ‘do the right thing: for our colleagues, for our customers, for our business’ and ensures we have the right level of oversight to give assurance to Board, committees and our Executive Management Team.
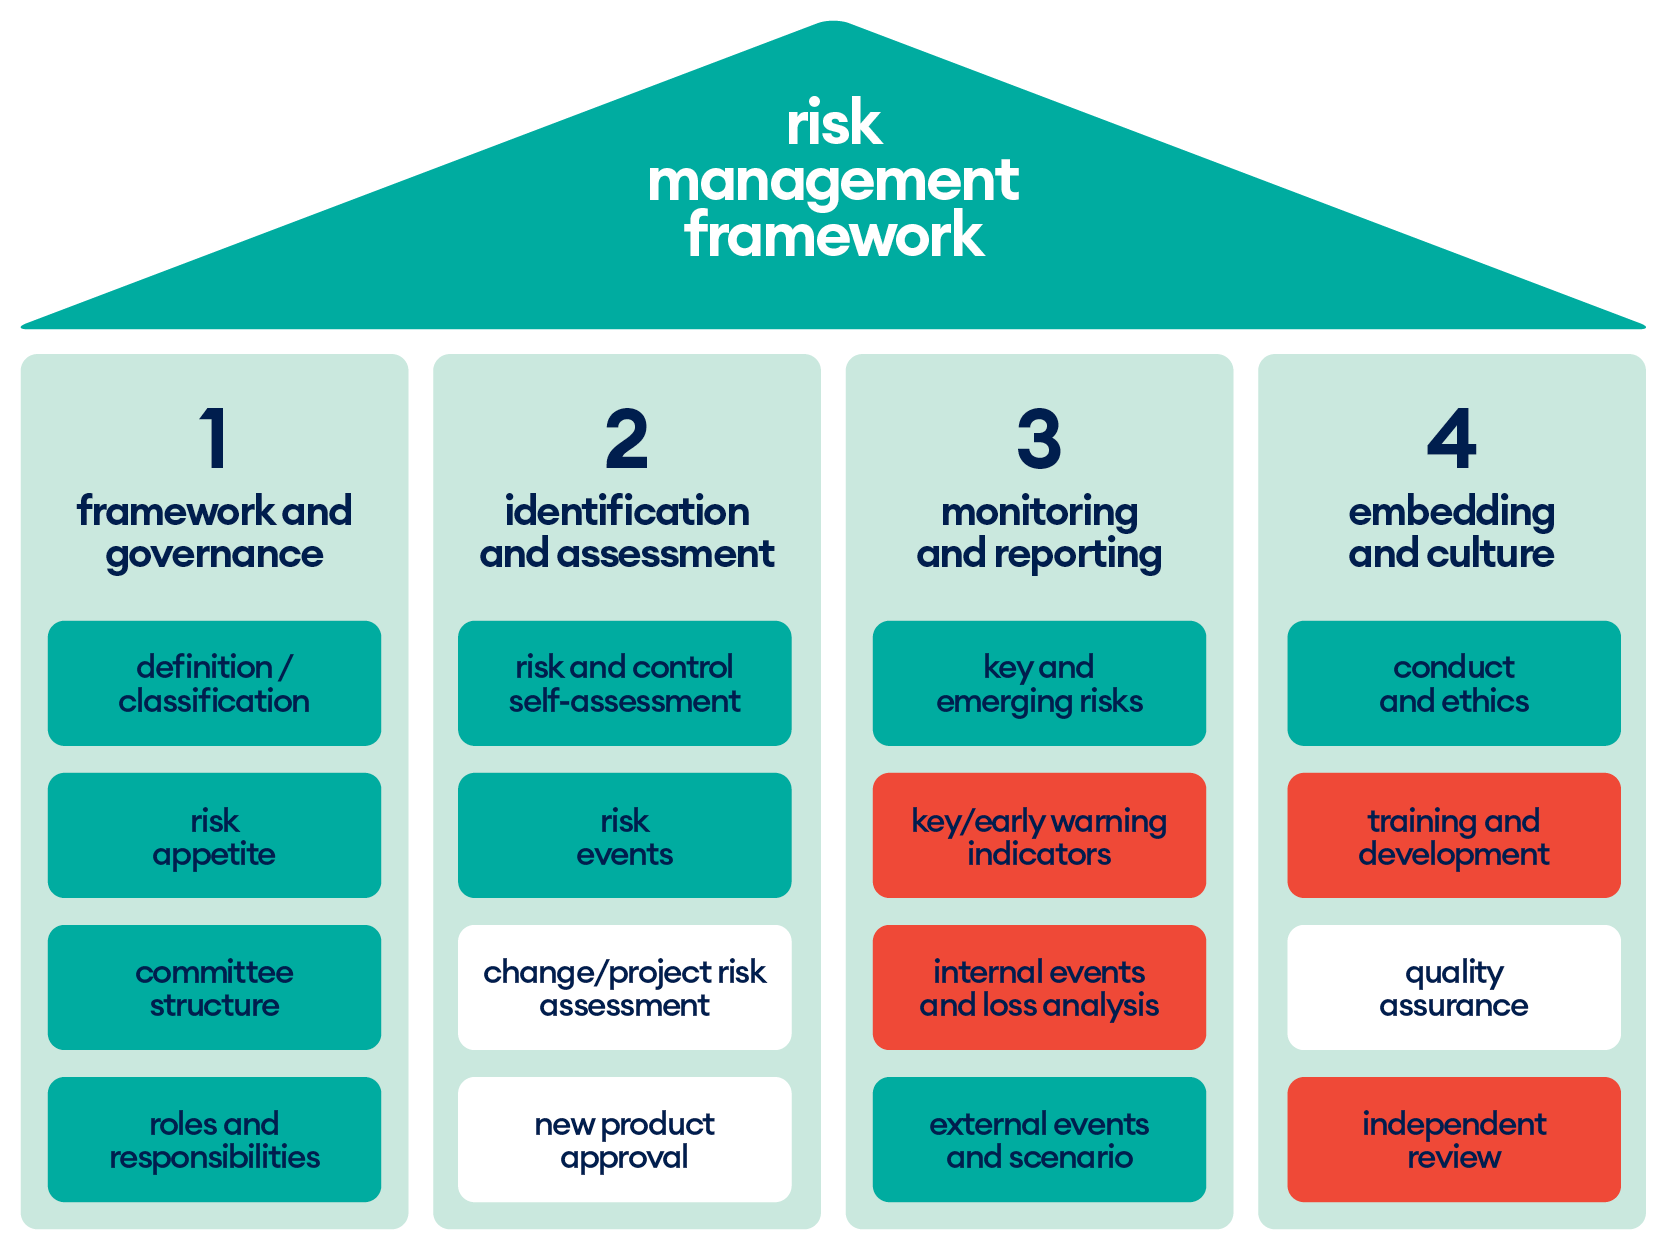
Our approach to risk is managed using a well-established risk management framework, using the four key pillars outlined in the framework below:
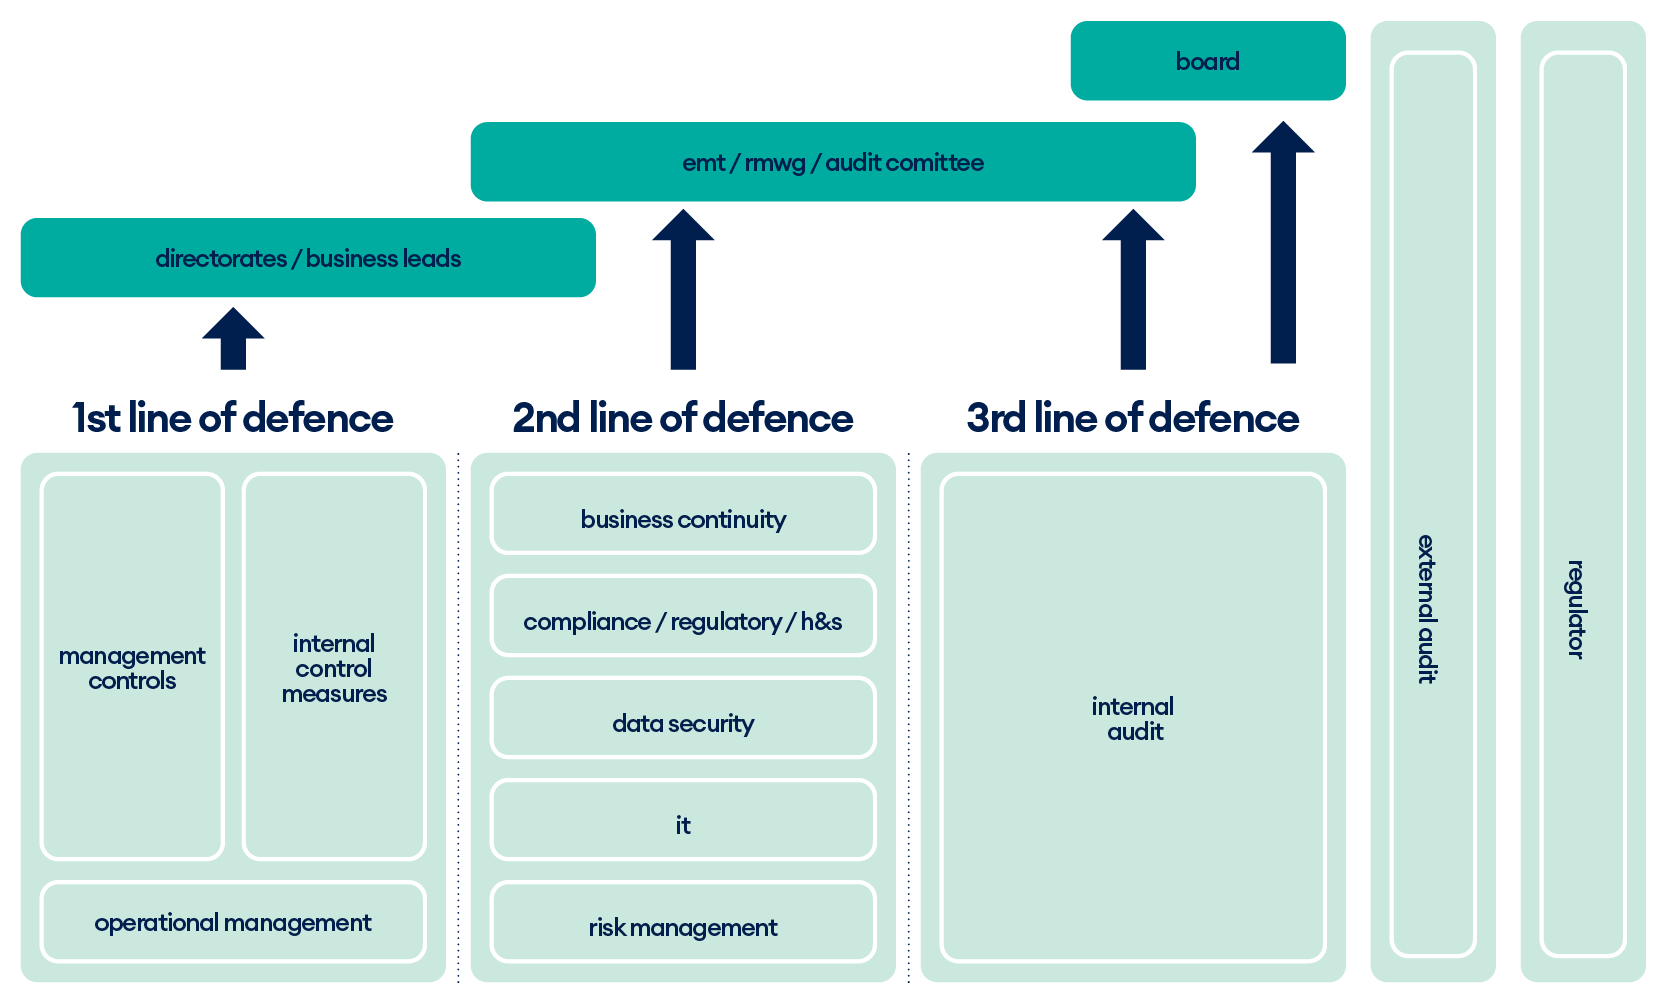
We continue to operate a ‘three lines of defence’ model. First line are the directors and managers with direct responsibility for the daily management and control of risk. Second line includes our Board, Audit Committee, Executive Management Team (EMT), Risk Management Working Group (RMWG) and specialist colleagues who oversee the effectiveness and integrity of the risk management framework. The third line includes independent and objective assurance from external partners such as external audit, internal audit and technical/specialist consultants.
We regularly review our risk registers and risk and control self-assessments (RCSA) with risk owners, risk leads and at quarterly RMWG meetings, highlighting any new or emerging risks in the external landscape and identifying mitigation plans. A quarterly risk report is produced, informed by these discussions, which is presented to, and discussed with, our Audit Committee and Board.
RMWG also focuses on where potential risk exposures, including ESG risks, may present opportunities and utilise a horizon radar to visualise our position as a business. This helps to focus our approach so we can proactively take opportunities to benefit the business as they arise. Our Board is regularly updated on both risks and opportunities and sets the risk appetite for our organisation which provides clear parameters on risk tolerance and leveraging opportunities and informs decision-making. Our current internal and external audit partners were appointed from 1 April 2025.
Board and trustees
As part of our commitment to equity, we continue to strive to have a diverse Board that reflects the communities we live in while recognising we need certain skill sets to meet the business need. We have previously highlighted our Board Trainee Programme as one of the mechanisms we would use to bring a more diverse Board and we are delighted that one of these trainees has been appointed to our Board this year, bringing with them an existing understanding of our business and the ability to hit the ground running.
Our current Board make-up includes the following:
| 2023/24 | 2024/25 | |
| % of Board that are women | 41.7% | 44.4% |
| % of Board that are BAME | 0.0% | 0.0% |
| % of Board that have a disability | 8.3% | 11.1% |
| % Board that are residents | 8.3% | 11.1% |
| % of Board that are LGBTQ+ | - | - |
| Average age of Board members (years) | 58.16 | 54.4 |
| Average Board tenure (years) | 3.05 | 2.77 |
There has been a 50% turnover at both Board level and in our Executive Management Team in the past two years. Following the adoption of the new 2020 Code of Governance, there was a change in tenure from nine to six years. We have a selection of Board members that will serve up to a nine-year term where this is in the best interests of the organisation, with the remainder who will serve six years unless the Board approves a longer term that would be in the best interests of the business. Our Board membership is made up of 83.3% non-executive directors and four of our Board members sit on our Audit Committee, all of whom have financial experience and expertise with two having professional financial qualifications.
Renewal and succession policy documents aim to deliver a Board that includes people from diverse backgrounds and with diverse attributes to provide healthy debate and challenge from a range of perspectives.
Following feedback from Board and our Customer Voices group, the standard reporting template has been updated to put a greater emphasis on how we evidence customer voice in our reports and how we can demonstrate this has influenced our decisions. We will continue to review our policy approval process to ensure the impact on customers have been evaluated and is transparent to our customers. This will include using data and insight as well as traditional methods of engagement.
Conflicts of interest are declared annually in a general declaration and at the earliest opportunity, should a specific situation or conflict arise. The publicly available register of interests is reported to the Board annually. Beyond this, interests are declared at the relevant meeting and form a standard agenda item at all Board and committee meetings, recorded in the minutes.
Our Chief Executive role and the Chair of the Board are two separate roles held by two different individuals. Our Chief Executive has been in place two years, and we appointed a new Chair of our Board in October 2024. We also have a Senior Independent Director (SID) who deals with potential conflict or issues within the Board and is there for Board members to raise any concerns with.
Supply chain management
Social Value is considered in all procurement activities and is evaluated using the TOMs Framework (Themes, Outcomes and Measures). The TOMs version that is used is specific to County Durham and has been in place for some time. The TOMs version has been created in partnership with the County Durham Pound Project and the Social Value Portal. The main themes of the TOMs framework are Jobs, Growth, Social, Innovation and Environmental. This includes a focus on engagement with SMEs, which is now a key objective of the National Procurement Policy Statement (NPPS) alongside a requirement to consider Social Value in all procurements.
The NPPS was brought in with the introduction of the Procurement Act 2023 (PA2023). As a standard, Social Value is weighted in procurement activities with a 10% weighting of the overall score, which is further split into the quantitative and qualitative elements with a focus on delivery within believe housing’s operating area. Social Value proposals are logged and referenced as part of supplier management meetings to ensure delivery of those stated proposals. Contract terms and conditions have been amended in line with PA2023 to ensure that proposals become a contracted element to be managed and delivered alongside other KPIs.
We monitor the sustainability of our supply chain through formal risk registers. These have been developed following the implementation of PA2023 to ensure that a complete risk register is logged and monitored throughout the three main elements of the contract lifecycle. Those three elements are: pre-procurement planning, procurement exercise and contract award, and contract delivery. Environmental specific questions are included within tender documents where the service lead feels that this is relevant and are evaluated accordingly in line with the published scoring methodology for the specific tender.
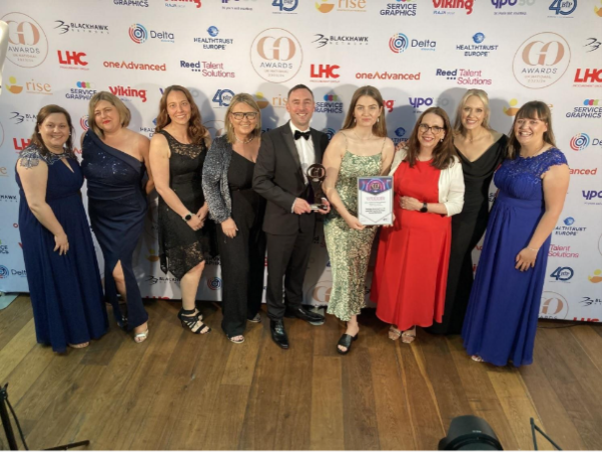
We have been recognised as partners of the County Durham Pound in May this year, winning the award for Best Collaborative Procurement at the UK National GO Awards. We were also highly commended in the category for Social Value Award.
Read more